Heat Cycle Analysis

Fig. 1. A P-H Diagram explaining the heat pump cycle of the air conditioner.
We analyzed the heat cycle of the CERV2 system by calculating the energy flow in each of the processes. We performed these calculation based on the normal working conditions of the system. Specifically, the condensing temperature is at 30℃ and the evaporation temperature is at 0℃. The condensing pressure is at 770 kPa and the evaporating pressure is at 293 kPa. The normal working mass flow rate is between 0.005 to 0.01 kg/s so we use the average value of 0.0075kg/s.
The system uses refrigerant R-134a with an Embraco® VEG T11HB compressor. We can easily get the enthalpy values of the refrigerant from the tables in the textbook. We assume that the system is working in an ideal vapor-compression cycle.
We can compute the power required for the system by computing the power input at the compressor (the expansion valve does not input or output any power).
Compressor Power:
ẆC=ṁ(h1-h4)
Mass flow rate, ṁ = 0.0075 kg/s
h4,g = 247.23 kJ/kg
h1,g = 268.9 kJ/kg
ẆC = (0.0075)(268.9 - 247.23) = 0.163 kW
Also, we can obtain the heat transfer rate by looking at the mass flow rate and the enthalpy changes taking place in the condensation/evaporation processes.The enthalpy states can be acquired from the refrigerant table.
Heat transfer rate:
Q̇out=ṁ(h1-h2)
h2,f = 91.49 kJ/kg
Q̇out = (0.0075)(268.9 - 91.49) = 1.331 kW
Then, the performance of the system can be accessed if we calculate the coefficient of performance by dividing the heat transfer rate with the work required at the compressor. These calculations are shown below.
Cooling capacity:
Q̇in=ṁ(h4-h3)
h3,fg = 91.49 kJ/kg
Q̇in = (0.0075)(247.23 - 91.49) = 1.168 kW
Heat pump coefficient of performance:
γ=Q̇outẆC
γ = (1.331)/(0.163) = 8.163
Cooling coefficient of performance:
β=Q̇inẆC
β = (1.168)/(0.163) = 7.166
From the results of the above calculations we can see that under the normal working conditions, the system is performing very efficiently with COPs ranging from 7 to 8. This is largely consistent with the measured data provided by Build Equinox (Fig. 1).
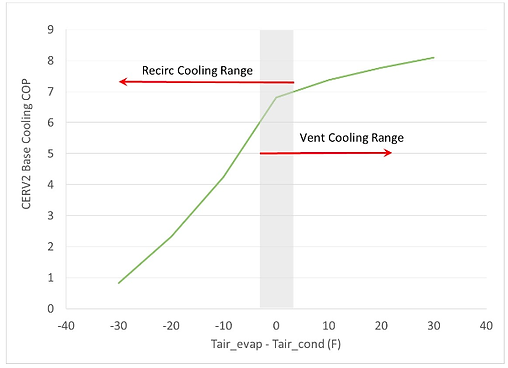
Fig. 2. Measured base cooling COP (excluding power from fans and controls) data from Build Equinox
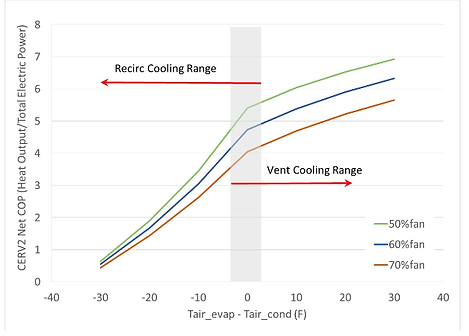
If we include the power consumption from the fans (2 fans in total, assuming 60% fan speed) and a 30 W control panel, the total power input (ẆC ) would be:
Pfan = 2×(3.8×10-4)F2.77 = 64 W
ẆC = 163W + 64W + 30W = 257 W
Assuming the heating and cooling output remains the same, the heat pump COP would become 5.18 and the cooling COP would be 4.54. These values are largely consistent with what was indicated by the performance characteristics provided in the documents from Build Equinox.